empty
13.11.2026 01:33 PM
Banks warn of fragility in bank funding as Bitcoin runs out of buyers

Bitcoin remains below $70,000, and a new threat has joined the list of factors weighing on the market. This time, it is not coming from the Federal Reserve but from the banking sector itself. A New York Fed study published on November 12 found that its model-based index of US bank liquidity stress has returned to levels last seen in 2014. For the crypto market, which is already losing money amid ETF outflows and a shrinking supply of stablecoins, this backdrop suggests that vulnerabilities are beginning to emerge from several directions at once.

This image is no longer relevant

The increase in the indicator since early 2022 reflects a decline in banks' liquid assets alongside a rise in unstable funding and off-balance-sheet liabilities. A separate calculation paints a less alarming picture, suggesting that if the 2022 interest rate shock were repeated, banks would need an additional $151 billion in capital, compared with $161 billion a year earlier. This suggests that capital is not the main weak point. Rather, the concern is banks' ability to retain funding if deposits and other sources of financing begin to flow out.

The potential transmission mechanism to Bitcoin runs through the credit market. Banks facing more expensive and less reliable funding become more selective when extending loans. Intermediaries that depend on this borrowing have fewer opportunities and less appetite to hold risky assets, including Bitcoin. Signs of this selective caution are already emerging. The Fed's October lending survey showed tighter lending standards across all categories of nonbank financial borrowers, while standards for large and medium-sized businesses remained largely unchanged.

Nevertheless, it is important to be clear that the study does not identify a funding shortage specifically affecting Bitcoin. The transmission of banking-sector fragility to the crypto market remains a logical inference rather than an observed fact.

Meanwhile, financial conditions are tightening even without direct involvement from banks. The Fed's policy rate remains in the 3.75%-4.00% range; the effective federal funds rate stood at 3.88% on November 11, and the yield on 10-year Treasury bonds reached 4.98% on November 10. A 25-basis-point rate hike on December 9 is already fully priced in, while futures markets point to further moves in January and March. Against this backdrop, banking-sector vulnerability represents a third transmission channel that could deprive the market of demand even before the next rate hike.

In my view, the study itself is unlikely to trigger an immediate crash. However, it undermines one of the strongest arguments made by Bitcoin bulls expecting a rebound: the prospect of cheaper money. As long as credit spreads remain contained and funding conditions stay stable, the pressure should remain moderate. Today's US PPI release, meanwhile, could act as a much faster catalyst.

Technical analysis and trading recommendations

This image is no longer relevant

Bitcoin

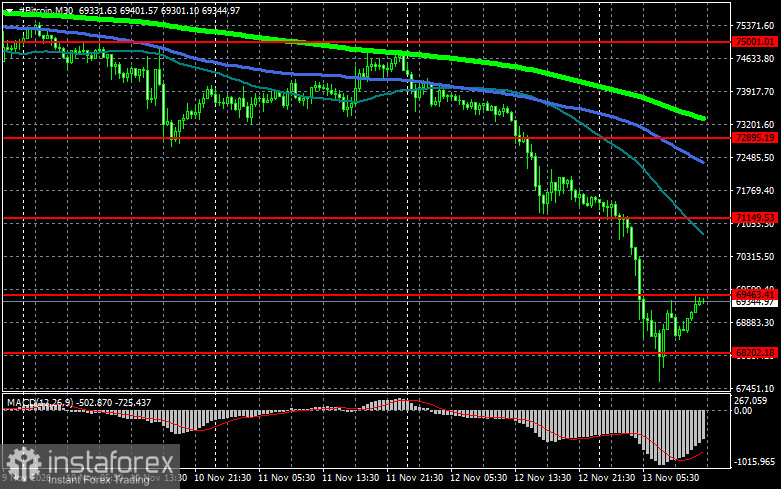
As for Bitcoin's technical outlook, buyers are currently targeting a recovery of the $69,400 level, which would open a direct path toward $71,100. Beyond that, $72,900 is within reach. A break above this level would signal attempts to restore the bullish market trend.

If Bitcoin declines, I expect buyers to step in around $68,200. A move back below this area could quickly send BTC toward $66,500. The next and most distant downside target is around $65,000.

This image is no longer relevant

Ethereum

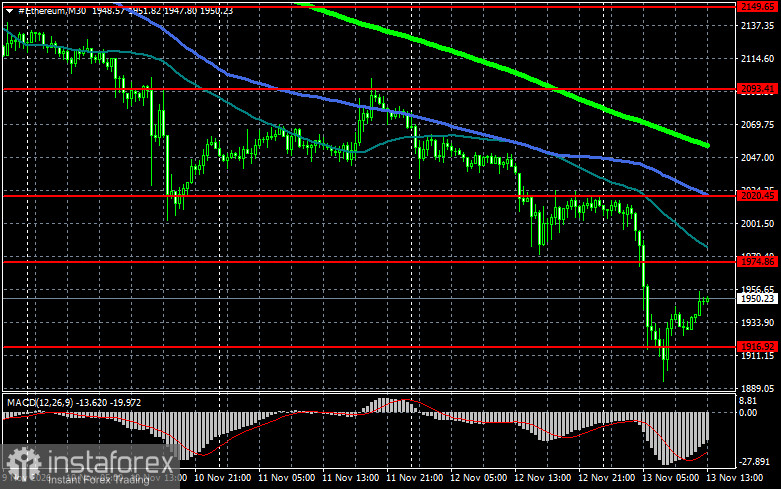
As for Ethereum's technical outlook, a clear consolidation above $1,974 would open a direct path toward $2,020. The next and most distant target would be the high around $2,093. A break above this level would signal strengthening bullish sentiment and a renewed return of buyer interest.

If Ethereum declines, I expect buyers to emerge around $1,916. A move back below this area could quickly push ETH toward $1,872. The next and most distant downside target is around $1,834.

What's on the chart

  • The red lines represent support and resistance levels, where the price is expected to either pause or react sharply.
  • The green line shows the 50-day moving average.
  • The blue line is the 100-day moving average.
  • The lime line is the 200-day moving average.

Price testing or crossing any of these moving averages often either halts movement or injects fresh momentum into the market.

Gana con los cambios en el valor de las criptomonedas con InstaForex.
Descarga MetaTrader 4 y abre tu primera operación.
  • Grand Choice
    Contest by
    InstaForex
    InstaForex always strives to help you
    fulfill your biggest dreams.
    UNIRSE AL CONCURSO
  • Depósito al azar
    ¡Haga un depósito en su cuenta de $3,000 y obtenga $5000 más!
    ¡En Noviembre, sorteamos $5000 dentro de la campaña Depósito afortunado!
    Obtenga la oportunidad de ganar depositando $3,000 en una cuenta de operaciones. Tras haber cumplido esta condición, se convertirá en un participante de la campaña.
    UNIRSE AL CONCURSO
  • Opere de forma inteligente, gane un dispositivo
    Recargue su cuenta con al menos $500, regístrese en el concurso y tenga la oportunidad de ganar dispositivos móviles.
    UNIRSE AL CONCURSO
  • 30% de bonificación
    Reciba un bono del 30% cada vez que recargue su cuenta
    OBTENER BONO

Recommended Stories

¿No puede hablar ahora mismo?
Ingrese su pregunta en el chat.
Widget callback